Before we get into the Chandler Real Estate Market Report for January 2022, I have a commentary written by Tina Tamboer. Tina is the Senior Housing Analyst with the Cromford report. She was nice enough to let us use her summary of the Greater Phoenix Metro area as a backdrop for what is happening in Chandler this month. Here is her commentary…
?️ The Greater Phoenix Metro Summary Analysis Real Estate Market Report
Cost to Rent vs. Buy in 2022
Owner Occupant Buyers Retreated in 2021
? For Buyers:
As the cost of purchasing a home increases in Greater Phoenix, the question of whether to rent or buy becomes harder to answer for some buyers. The overall median cost of a home is currently $425,000, and for a typical 1,500-2,000 square foot home, the median cost is $420,000. The estimated payment, assuming 10% down and including principal, interest, taxes and insurance, is $2,123. The median monthly rental rate for the same size range, recorded through the Arizona Regional MLS, was $2,195 in the 4th quarter of 2021; just $72 per month more.
Some buyers might question the advantage of purchasing a home in order to save $72 per month. However, the financial advantage of owning vs. renting is typically realized for those who own their home for at least 3-5 years.
Example:
Let’s assume, hypothetically, that a buyer purchased a home today for $420,000 with a $42,000 down payment (10%). Over the next 5 years, their home’s value fluctuates up and down and in the end, doesn’t appreciate. That may sound horrifying, however during this time the loan principal has been paid down to $336,000. The homeowner’s equity has doubled from $42,000 to $84,000 without their home appreciating a dime, and with 20% equity, they no longer have to pay private mortgage insurance. Their payment declines $200. Still a win.
Now let’s assume, hypothetically again, that while our homeowner is paying down their loan, the home value fluctuates up, down, and sideways, but still averages a 6% appreciation rate over 5 years (close to the current rate of inflation). The home would then be worth $562,000, an increase of $142,000.
After 5 years, this hypothetical homeowner went from $42,000 to $226,000 in equity, and their monthly cost was nearly the same as what they would have paid in rent anyway. For this reason, even when the monthly payment required to buy is close to that to rent, buying still wins in the long game.
? For Sellers:
Despite rumors of the U.S. housing market cooling off, Greater Phoenix has moved farther into a seller’s market over the past month. The growing disparity between supply and demand in our market means there is little evidence to suggest price appreciation will slow in the first quarter. After a strong summer, new listings slowed down in the 4th quarter of 2021, while the number of accepted contracts remained high. The result is 2022 starting off with another historically low supply level, and listings under contract, while 7.6% below 2021, still strong with the 2nd highest count since 2014.
It’s an accepted opinion among local analysts that income levels in Greater Phoenix cannot sustain another year of 28% annual appreciation, especially if interest rates continue to increase. However, seeing there is little relief from home builders adding more supply to the equation, it’s reasonable to expect the market to respond with a softening of demand. This trend started to reveal itself in the 2nd Quarter of 2021 in a subtle manner.
Retreat of Traditional Buyers
Since 2014, buyers purchasing their primary residence have made up 70%-76% of total residential purchases in Maricopa and Pinal County. In Q2 2021, that percentage dipped to 67% and declined to 63% by October. While traditional buyers retreated, competing buyers for 2nd homes and institutional buyers made up of Wall Street-backed iBuyers, hedge funds and other investment groups stepped in. Price appreciation slowed from an average of 3.3% per month to 1.1%.
While 2022 is coming out of the gate strong, and Spring is typically the strongest season for buyers, it remains to be seen how much control investors and 2nd home buyers will take if traditional home buyers retreat. The last time they ignored affordability issues within the community, everyone lost in the end.
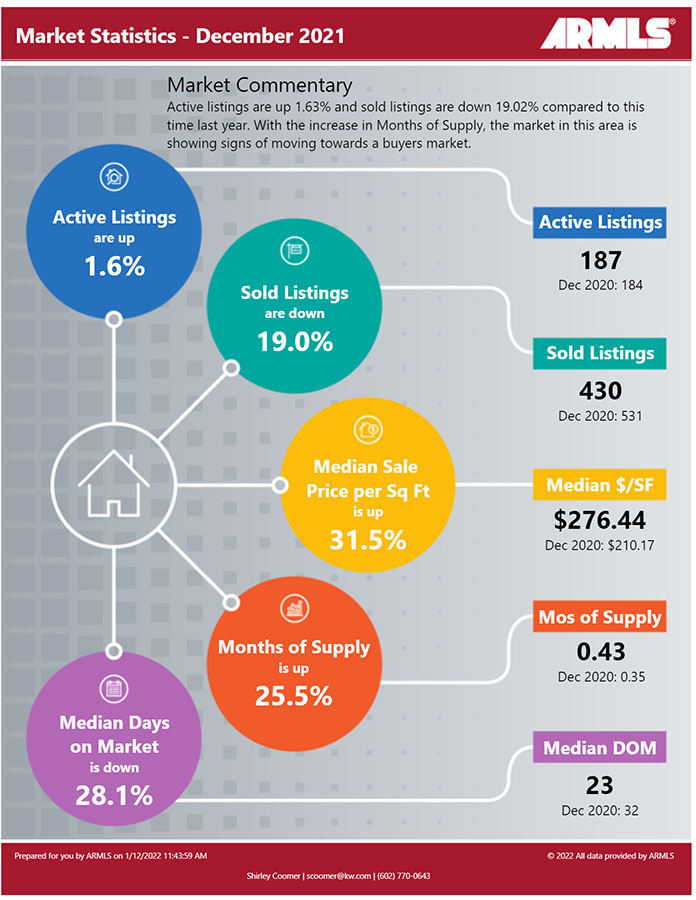
Below you will find the statistical breakdown and more for the Chandler area Real Estate Market Report December 2021.
View All Current & Past Phoenix & East Valley Real Estate Market Reports
? Below is a snapshot of Chandler’s Real Estate Market Statistics for December 2021
?️ What are the Average Temperatures in Phoenix?
| Month | Low | High |
|---|---|---|
| Jan | 43.4°F | 65.0°F |
| Feb | 47.0°F | 69.4°F |
| Mar | 51.1°F | 74.3°F |
| Apr | 57.5°F | 83.0°F |
| May | 66.3°F | 91.9°F |
| Jun | 75.2°F | 102.0°F |
| Jul | 81.4°F | 104.2°F |
| Aug | 80.4°F | 102.4°F |
| Sept | 74.5°F | 97.4°F |
| Oct | 62.9°F | 86.4°F |
| Nov | 50.0°F | 73.3°F |
| Dec | 43.5°F | 65.0°F |
Phoenix’s coldest month is January when the average temperature overnight is 43.4°F. In July, the warmest month, the average daytime temperature rises to 104.2°F. If you would like to see specific homes as they come on the market, click here to get email updates.
? A look at Chandler’s current Sales Price. Real Estate Market Report for January 2022
In December, Chandler’s Median Sales Price was $490,000 up from last month’s $472,500 and the prior months’ $480,000, $469,900 and $465,000. As inventory levels remain at unheard of low levels, there has been continued pressure on the sales price as folks need to bid above the listing price to be the winning bid on the house.
If you are in the process of Buying or Selling a Home, Click on the highlighted link to see a number of interesting articles.
❓ What does this mean if you are a Buyer or a Seller?
Real Estate Market Report
As the chart above shows the Phoenix housing market Inventory remains at historic low levels. Buyers should be prepared to jump on any listing that fits their needs. With inventory at these lows, make sure you make your offer as clean as possible (no contingencies). Based on Tina’s comments above, you may have to pay over the list price to get the deal.
Sellers should expect multiple offers due to this low inventory level. We are seeing many more multiple offers as inventory drops. Know the market value of your home. When you start getting offers above list price and potential market price, be cognizant of a potential appraisal issue or look for offers with appraisal waivers/contingencies.
If you would like to see specific homes as they come on the market, click here to get email updates.
?️ What is the annual rainfall in Phoenix?

| Month | Precipitation |
|---|---|
| Jan | 0.83in. |
| Feb | 0.77in. |
| Mar | 1.07in. |
| Apr | 0.25in. |
| May | 0.16in. |
| Jun | 0.09in. |
| Jul | 0.99in. |
| Aug | 0.94in. |
| Sept | 0.75in. |
| Oct | 0.79in. |
| Nov | 0.73in. |
| Dec | 0.92in. |
The driest month in Phoenix is June with 0.09 inches of precipitation, and with 1.07 inches March is the wettest month.
?️ Homes For Sale in Chandler AZ
Below are Homes that have come on the market in the last 7 Days around the Median price range. Also below the pictures, you will see a Chart of all the Chandler homes by price and Type: Below are all the homes available in the city of Chandler by Dollar amount and type:
? Below you will see the links for the other cities in the East Valley:
View All Current & Past Phoenix & East Valley Real Estate Market Reports
Contact the Shirley Coomer Group at Keller Williams Realty Sonoran Living
![]()
Call or Text: 602-770-0643 for more Real Estate Information.
