Below you will find the statistical breakdown and more for the Chandler area Real Estate Market for May 2018.
View All Current & Past Phoenix & East Valley Real Estate Market Reports
Below is a snapshot of May’s Real Estate Market Statistics for Chandler AZ.
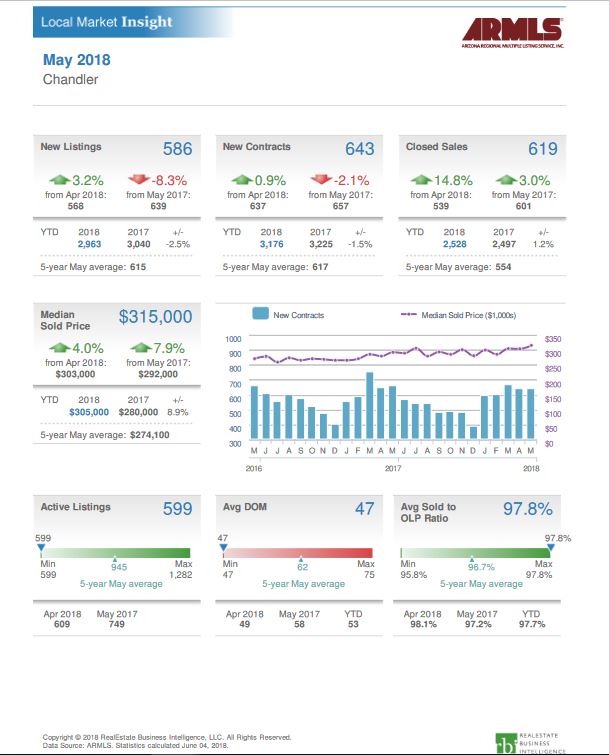
The number of new listings in Chandler for May was 586 up 3.2% from April. New contracts also increased by .9% to 643. We saw 619 home sales completed in May up 14.8% from April. Median sales price was $315,000 up 4.0% from April. There were 599 active listing in Chandler with the average days on market of 47. The average sold price to list price was 97.8% down by .3% from prior month.
Chandler Homes for Sale by Bedrooms & Median price:
What does this mean if you are a seller?
For sellers, inventory levels remained basically flat while sales volume increased by 14.8% from the prior month. We currently have .97 months of inventory available for Sale which is a decrease of 14.2% from April. This shows an even stronger seller’s market as compared to last month’s 1.13 months of inventory. If priced correctly, sellers can expect to sell in less than the average 47 days on market we saw in May. Buyers are not going to overpay, but houses priced correctly and in good condition will sell, often with multiple offers. For May, we saw the list to contract price of 97.8% down by .3% from April. We also saw the median price rise by 4% to $315,000.
![]()
What does this mean if you are a buyer?
For buyers, a inventory of .97 months (compared to 1.13 months in April) is not welcome news since this indicates we are even moving to a stronger sellers market. Sellers continue to have a distinct advantage since there are very few homes available. Anything under 3 months of inventory is considered a seller’s market. So those homes that are priced right may get multiple offers. The buyer has to remain diligent about their offers. If you are serious about an offer, have your agent provide you comparable properties to determine the best price for the house. Asking for seller concessions or a low ball offer is not a good strategy in this seller’s market. Remember, sellers also know the value of their home in this market. Their agents are keeping sellers updated on recent sales and homes similar to theirs as they come on the market.
Homes For Sale in Chandler AZ.
Below are Homes that have come on the Market in the last 7 Days around the Median price range. Also below the pictures, you will see a Chart of all the Chandler homes by price and Type:
Below are all the Homes available in the city of Chandler by Dollar amount and type:
Below you will see the links for the other cities in the East Valley:
View All Current & Past Phoenix & East Valley Real Estate Market Reports