Before we get into the Chandler Real Estate Market Report September 2019, I have commentary written by Tina Tamboer. She is the Senior Housing Analyst with the Cromford report. She was nice enough to let us use her summary of the Greater Phoenix Metro area as a backdrop for what is happening in Chandler this month. Here is her commentary…….
The Greater Phoenix Metro Summary Analysis
New Listings Up 10% from July to August
Supply is Down 73% in this Area and Price Range
For Buyers:
A faint glimmer of good news for buyers, supply finally stopped declining and actually rose a tiny bit in the last week. While active listings are still 16% lower than they were this time last year, they’re 1% higher than 4 weeks ago. This rise can be attributed to a 10% increase in new listings from July to August, which is not uncommon as July is typically a low point in the year for new listings. However this August, was 3% below last August in comparison and the lowest August since 2016. One price range that is still declining in supply is $200K-$250K, which has plummeted 51% since February.
The Southeast Valley on the Maricopa County side has seen the largest decline of 73% in the $200k-$250K price range for single family homes. Gilbert is especially low with only 5 listings in the entire city under $250K as of September 9th, all of them townhomes with an average size of 1,116 square feet.
For Sellers:
For some sellers the idea of listing their home is stressful, even if they really need to sell it. The pressure of keeping their home clean for showings and open houses, enduring negative feedback, and the unknowns of the inspection report can send homeowners right into the arms of flip investors who will happily buy their home “as is” with significant fees attached.
While there is nothing wrong with doing that (there is value in ease and certainty) sellers should understand that if their home lands within a frenzy price range for their area. This is where there are literally more homes under contract than there are for sale. Buyers may be pleasantly surprised at how little they have to do to sell it on the MLS. Negotiable listing costs, multiple contracts and buyers willing to buy “as is” make this the perfect market for sellers who know their home is not so perfect. To find out if your property lands in a frenzy zone, contact your local Realtor.
Commertary written by Tina Tamboer, Senior Housing Analyst with The Cromford Report
@2019 Cromford Associates LLC and Tamboer Consulting LLC
Below you will find the statistical breakdown and more for the Chandler area Real Estate Market Report September 2019 ( with prior month and year data).
View All Current & Past Phoenix & East Valley Real Estate Market Reports
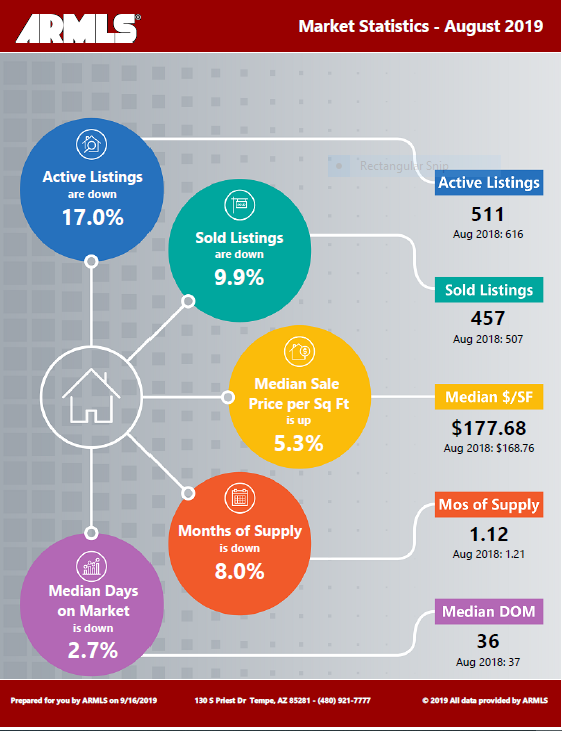
Below is a snapshot of Chandler’s Real Estate Market Statistics for August 2019
A look at Chandler’s current Sales Price.
In August, Chandler’s Median Sales Price was $335,000. This compared to July’s $331,285 an increase of 1.1%. Currently, the YTD average Median price in Chandler is $320,500. This was a 1.1% increase from last months 317,000. With fewer homes on the market in recent months, the sales prices are increasing.
If you are in the process of Buying or Selling a Home, Click on the highlighted link to see a number of interesting articles.
What does this mean if you are a Seller or Buyer?
As the chart above shows, Inventory in Chandler remains low (1.12 months of inventory). This is a slight increase from last month but barely enough to cover whats under contract The Seller has the continued advantage due to such a low number of Homes on the Market.
Buyers will have to look to make offers that are very competitive in price along with as few contingencies as possible. Buyers should be ready to react quickly when they see a home they want to place an offer on so to beat out the competition.
If you would like to see specific homes as they come on the Market, click here to get email updates.
Homes For Sale in Chandler AZ
Below are Homes that have come on the Market in the last 7 Days around the Median price range. Also below the pictures, you will see a Chart of all the Chandler homes by price and Type:
Below are all the Homes available in the city of Chandler by Dollar amount and type:
Below you will see the links for the other cities in the East Valley:
View All Current & Past Phoenix & East Valley Real Estate Market Reports
Contact the Shirley Coomer Group at Keller Williams Realty Sonoran Living
![]()
Call or Text: 602-770-0643 for more Real Estate Information.
