Before we get into the Gilbert Real Estate Market Report in March 2020, I have a commentary written by Tina Tamboer. Tina is the Senior Housing Analyst with the Cromford report. She was nice enough to let us use her summary of the Greater Phoenix Metro area as a backdrop for what is happening in Gilbert this month. Here is her commentary…..
The Greater Phoenix Metro Summary Analysis Real Estate Market Report March 2020
Officially a Frenzy: 11% More Contracts Than Listings For Sale
Contracts Over $1M up 60% Over Last Year
For Buyers:
Not even the COVID-19 coronavirus can slow down the Greater Phoenix housing market. For every 100 active listings in the Arizona Regional MLS, there are 111 that are already under contract. Greater Phoenix is officially a frenzy and it’s only March. We can expect to see this continue at least through May without relief as buyer demand is typically highest in the Spring.
It’s even more dramatic in the Southeast Valley, West Valley and North Phoenix and all areas where prices land between $175K-$300K. For a stark example, on March 7th in Glendale, there were 3 properties for sale between $175K-$200K and 25 under contract. In Chandler, there were 3 properties active between $200K-$250K and 37 under contract. In the North Phoenix Moon Valley area there were 8 properties for sale between $250K-$300K and 30 under contract.
There is a reason why people continue to pounce on what’s available for sale. The average price for a 1,500-2,000 SF home is now $331K and continues to rise. That may seem alarming considering it was $324K at a peak in 2006. Contrary to popular belief it’s more affordable today because of the interest rates. In April 2006, with an average of 6.51% the monthly principal and interest payment on a 30-year fixed loan with 10% down was $1,854.
Today at an average of 3.45% the same home is $1,331, a savings of $523. More recently, over the last 16 months despite prices having risen 9.4% for median-sized homes the monthly payment dropped by approximately $112/month.
For Sellers:
There’s not much more to say to sellers under $500k, frankly, their homes may be sold before we’re done saying it. The stark gap between supply and demand doesn’t ease up until budgets go over $600K. Sellers in areas such as North Scottsdale, Paradise Valley, the Camelback Corridor, and Downtown Phoenix still have plenty of competition to contend with, but well-priced, updated, move-in ready homes will still see heightened buyer interest.
The luxury market is doing exceptionally well, however, sellers should not expect the stampedes seen in the rest of the market. There are 522 properties under contract over $1M, up a whopping 60% over last year at this time. However, there are still 1,657 competing properties for sale in this price range and those that sold in February averaged 5-6 months on the market.
The commentary was written by Tina Tamboer, Senior Housing Analyst with The Cromford Report ©2020 Cromford Associates LLC and Tamboer Consulting LLC
Below you will find the statistical breakdown and more for the Gilbert area Real Estate Market Report March 2020 (with the prior month and year data).
View All Current & Past Phoenix & East Valley Real Estate Market Reports
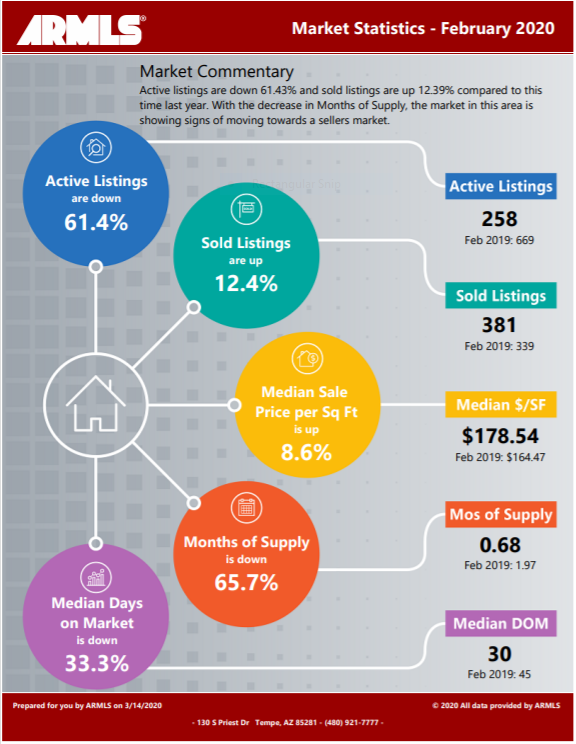
Below is a snapshot of Gilbert’s Real Estate Market Statistics for February 2020
What are the Average Temperatures in the Phoenix Metro area?
| Month | Low | High |
|---|---|---|
| Jan | 43.4°F | 65.0°F |
| Feb | 47.0°F | 69.4°F |
| Mar | 51.1°F | 74.3°F |
| Apr | 57.5°F | 83.0°F |
| May | 66.3°F | 91.9°F |
| Jun | 75.2°F | 102.0°F |
| Jul | 81.4°F | 104.2°F |
| Aug | 80.4°F | 102.4°F |
| Sept | 74.5°F | 97.4°F |
| Oct | 62.9°F | 86.4°F |
| Nov | 50.0°F | 73.3°F |
| Dec | 43.5°F | 65.0°F |
Phoenix’s coldest month is January when the average temperature overnight is 43.4°F. In July, the warmest month, the average day time temperature rises to 104.2°F.
If you would like to see specific homes as they come on the market, click here to get email updates.
A look at Gilbert’s current Sales Price. Real Estate Market Report March 2020
In February, Gilbert’s Median Sales Price was $373,650 up 5.3% from last month’s $355,000. With the continued extremely low inventory of .68 months, prices spiked. We will have to watch what happens closely with the Coronavirus concerns to understand the impact on the market
If you are in the process of Buying or Selling a Home, Click on the highlighted link to see a number of interesting articles.
What does this mean if you are a Seller or a Buyer for the Real Estate Market Report March 2020?
Real Estate Market Report
As the chart above shows, Inventory in Gilbert remains extremely low and continues to drop. This month we are at .68 months of supply vs last months .87 ( 21.8% drop). We are currently in unheard-of levels. The Seller has the advantage due to such an extremely low number of homes on the market. However, we will have to watch what happens closely with the Coronavirus concerns to understand the impact on the market
Buyers will have to look to make offers that are very competitive in price along with as few contingencies as possible. Buyers should be ready to react quickly when they see a home they want to place an offer on so to beat out the competition. Have your agent talk with the seller’s agent to see if there are any terms desired by the seller that you can put in your offer. We will need to watch the impact on Buyers closely as the Coronavirus plays out.
If you would like to see specific homes as they come on the market, click here to get email updates.
What is the annual rainfall in Phoenix?
Average Rainfall for Phoenix

| Month | Precipitation |
|---|---|
| Jan | 0.83in. |
| Feb | 0.77in. |
| Mar | 1.07in. |
| Apr | 0.25in. |
| May | 0.16in. |
| Jun | 0.09in. |
| Jul | 0.99in. |
| Aug | 0.94in. |
| Sept | 0.75in. |
| Oct | 0.79in. |
| Nov | 0.73in. |
| Dec | 0.92in. |
The driest month in Phoenix is June with 0.09 inches of precipitation, and with 1.07 inches March is the wettest month.
Homes For Sale in Gilbert AZ
Below are Homes that have come on the market in the last 7 Days around the Median price range. Also below the pictures, you will see a Chart of all the Gilbert homes by price and Type:
Below are all the homes available in the city of Gilbert by Dollar amount and type:
Below you will see the links for the other cities in the East Valley:
View All Current & Past Phoenix & East Valley Real Estate Market Reports
Contact the Shirley Coomer Group at Keller Williams Realty Sonoran Living
![]()
Call or Text: 602-770-0643 for more Real Estate Information.
