Before we get into the Phoenix Real Estate Market Report February 2020, I have a commentary written by Tina Tamboer. She is the Senior Housing Analyst with the Cromford report. She was nice enough to let us use her summary of the Greater Phoenix Metro area as a backdrop for what is happening in Phoenix this month. Here is her commentary…….
The Greater Phoenix Metro Summary Analysis Real Estate Market Report
MLS Luxury Sales Over $1M Up 52% in January
Supply Between $200K-$250K Down 60%
For Buyers:
Supply continues to drop as the market heats up with the seasonal rush of Buyers. Typically, we would see supply rising at this time of year as January is a strong month for new listings to hit the market.
However, this year’s new listings year-to-date are down 17% from last year and January 2020 had the lowest number of new listings recorded going all the way back to 2001. Combine this with a 21% increase in sales volume and the 4th highest January recorded for MLS sales, and it’s no surprise that supply is plummeting.
While supply is down in all price points, it’s felt the most between $200K – 250K. Supply in this price range is nearly 60% lower than this time last year and a quarter of sales in the last 3 months have recorded over asking price.
Seller-paid closing cost concessions are also down. Nearly 22% of all sales in the 1st Quarter to date have included some form of seller-paid or assisted closing costs. That’s the lowest percentage recorded in nearly 5 years.
For Sellers:
The luxury market continues to go gangbusters in 2020. Sales over $1 Million in 2019 outperformed 2018 by 10%, which makes it the #1 year for in Greater Phoenix in this price range. January closings were up 52% in this price and listings under contract are up 43%.
With all this demand, one would think price appreciation would be rising significantly however that hasn’t happened yet. The average sales price per square foot between $1M-$2M has only appreciated 1% while those between $2M-$3M have appreciated 0.2% and those over $3M have increased 6%. The current appreciation rate per square foot is between 8-9% for Greater Phoenix as a whole.
The commentary was written by Tina Tamboer, Senior Housing Analyst with The Cromford Report
©2020 Cromford Associates LLC and Tamboer Consulting LLC
Below you will find the statistical breakdown and more for the Phoenix area Real Estate Market Report January 2020 (with the prior month and year data).
View All Current & Past Phoenix & East Valley Real Estate Market Reports
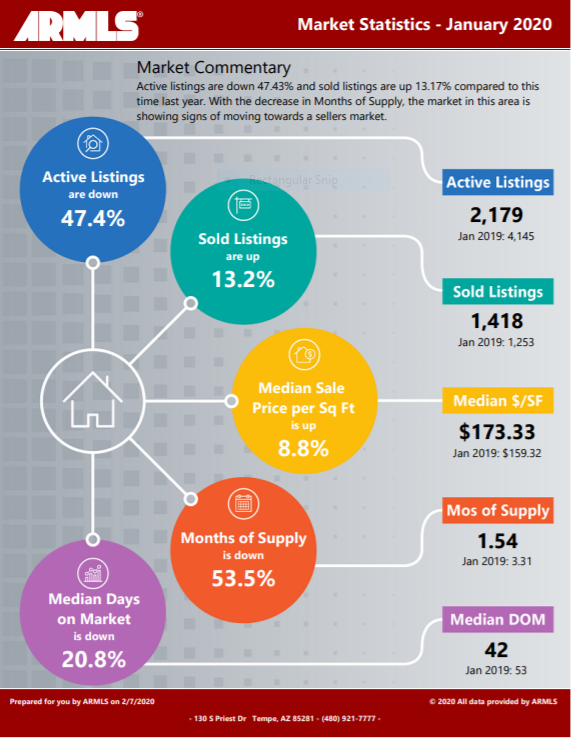
Below is a snapshot of Phoenix’s Real Estate Market Statistics for January 2020
A look at Phoenix’s current Sales Price. Real Estate Market Report
In January, Phoenix’s Median Sales Price was $265,000 as compared to December’s $274,250. This is more back in line with November’s 260,000. With overall inventory at historic lows, the median price will be driven more on which price points have the inventory that sells.
If you are in the process of Buying or Selling a Home, Click on the highlighted link to see a number of interesting articles.
What does this mean if you are a Seller or a Buyer?
Real Estate Market Report
As the chart above shows, Inventory in Phoenix is at 1.54 months up from last months 1.35 (an increase of 14.1%). This is a dramatic decrease from last years 3.31 months of inventory. The forecasters still believe that inventory levels will remain low for the foreseeable future. Sellers have the advantage due to such few Homes on the Market.
Buyers will have to make competitive offers. Also, as few contingencies as possible. Buyers will need to act quickly. So they can beat out the competition with the offer.
What are the Average Temperatures in the Phoenix Metro area?
What is the average temperature in Phoenix?
| Month | Low | High |
|---|---|---|
| Jan | 43.4°F | 65.0°F |
| Feb | 47.0°F | 69.4°F |
| Mar | 51.1°F | 74.3°F |
| Apr | 57.5°F | 83.0°F |
| May | 66.3°F | 91.9°F |
| Jun | 75.2°F | 102.0°F |
| Jul | 81.4°F | 104.2°F |
| Aug | 80.4°F | 102.4°F |
| Sept | 74.5°F | 97.4°F |
| Oct | 62.9°F | 86.4°F |
| Nov | 50.0°F | 73.3°F |
| Dec | 43.5°F | 65.0°F |
Phoenix’s coldest month is January when the average temperature overnight is 43.4°F. In July, the warmest month, the average day time temperature rises to 104.2°F.
If you would like to see specific homes as they come on the market, click here to get email updates.
Homes For Sale in Phoenix AZ
Below are Homes that have come on the market in the last 7 Days around the Median price range. Also below the pictures, you will see a Chart of all the Phoenix homes by price and Type:
Below are all the homes available in the city of Phoenix by Dollar amount and type:
What is the annual rainfall in Phoenix?
Average Rainfall for Phoenix

| Month | Precipitation |
|---|---|
| Jan | 0.83in. |
| Feb | 0.77in. |
| Mar | 1.07in. |
| Apr | 0.25in. |
| May | 0.16in. |
| Jun | 0.09in. |
| Jul | 0.99in. |
| Aug | 0.94in. |
| Sept | 0.75in. |
| Oct | 0.79in. |
| Nov | 0.73in. |
| Dec | 0.92in. |
The driest month in Phoenix is June with 0.09 inches of precipitation, and with 1.07 inches March is the wettest month.
Below you will see the links for the other cities in the East Valley:
View All Current & Past Phoenix & East Valley Real Estate Market Reports
Contact the Shirley Coomer Group at Keller Williams Realty Sonoran Living
![]()
Call or Text: 602-770-0643 for more Real Estate Information.
