Before we get into the Phoenix Real Estate Market Report for November 2020, I have a commentary written by Tina Tamboer. Tina is the Senior Housing Analyst with the Cromford report. She was nice enough to let us use her summary of the Greater Phoenix Metro area as a backdrop for what is happening in Phoenix this month. Here is her commentary…..
?️ The Greater Phoenix Metro Summary Analysis Real Estate Market Report
Demand for Homes Up 36%
Rents up 17% Since April
? For Buyers:
The Rent vs. Buy scenario has become heavily in favor of buying over the last 5 months. Eviction moratoriums due to the pandemic have greatly reduced turnover rates in a rental market that is already short of supply. Lease rates on listings through the Arizona Regional MLS have increased 17% since April overall; and for a home between 1,500-2,000 sf, the median lease price in the 4th Quarter is $1,850 a month, up a whopping $255 from the 4th Quarter last year.
While leases have been rising, home values have also risen 16%; however, declining interest rates have kept the monthly payments level. The median sales price for a 1,500-2,000sf home is currently $316,000, up $27,000 since April. Despite this 9% increase (assuming a $15,000-$30,000 investment and interest rate under 3%), purchasing a home could possibly save a renter hundreds of dollars on their monthly budget while simultaneously building equity and ensuring a level of stability in their housing cost.
? For Sellers:
While many people are waiting for the final results of the 2020 election, at least one thing is for certain in Greater Phoenix. The housing market will not crash in 2021 regardless of the outcome. It may be hard to believe, but the new and resale housing markets don’t move quickly. Unlike the stock market where it takes a push of a button to sell a stock and record the price, it takes longer to sell a home between the marketing time and escrow process. In today’s market, it may take up to a week to negotiate an offer and another 30-45 days for the price to be publicly recorded. When a market weakens, it takes longer.
Supply in Greater Phoenix has been gradually shrinking for 6 years and was the driver behind price appreciation until the pandemic. To put things in perspective, the Arizona Regional MLS should seasonally have between 25,000-30,000 listings active at this time of year; as of November 9th, there are under 8,600. That type of shortage doesn’t happen overnight and new construction will not be able to fill the gap quickly.
This is a Sellers Market
Listings Under Contract should seasonally have between 9,000-10,000 in escrow at this time of year; as of November 9th, there are over 13,000. This level was reached in June and has stayed consistent for nearly 5 months. Even if demand were to scale back in 2021 and return to a normal level, the market would not see a massive drop in prices; just a slowing in appreciation.
Commentary was written by Tina Tamboer, Senior Housing Analyst with The Cromford Report
©2020 Cromford Associates LLC and Tamboer Consulting LLC
Below you will find the statistical breakdown and more for the Phoenix area Real Estate Market Report October 2020.
View All Current & Past Phoenix & East Valley Real Estate Market Reports
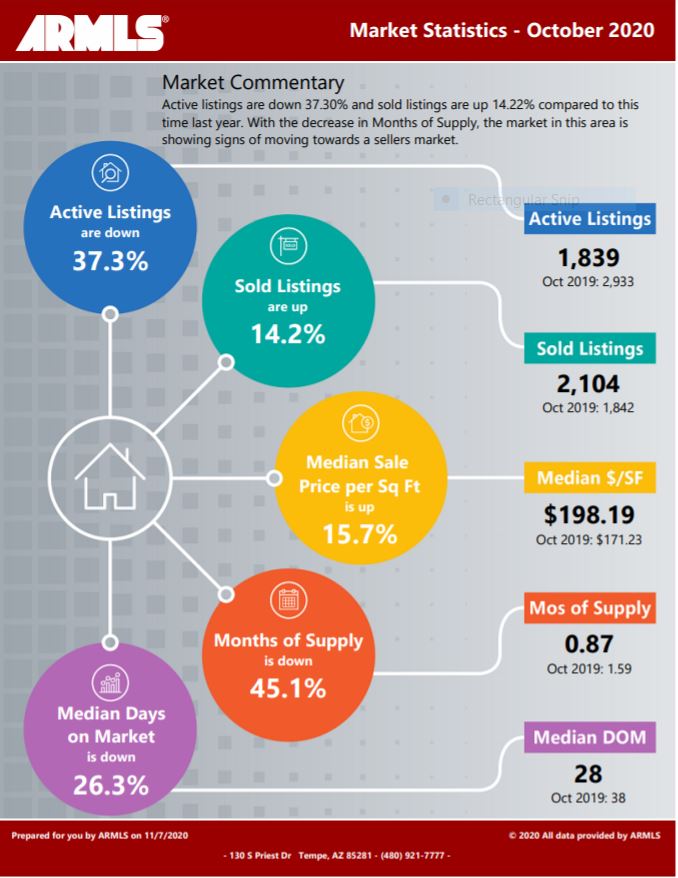
? Below is a snapshot of Phoenix’s Real Estate Market Statistics for October 2020
?️ What are the Average Temperatures in Phoenix?
| Month | Low | High |
|---|---|---|
| Jan | 43.4°F | 65.0°F |
| Feb | 47.0°F | 69.4°F |
| Mar | 51.1°F | 74.3°F |
| Apr | 57.5°F | 83.0°F |
| May | 66.3°F | 91.9°F |
| Jun | 75.2°F | 102.0°F |
| Jul | 81.4°F | 104.2°F |
| Aug | 80.4°F | 102.4°F |
| Sept | 74.5°F | 97.4°F |
| Oct | 62.9°F | 86.4°F |
| Nov | 50.0°F | 73.3°F |
| Dec | 43.5°F | 65.0°F |
Phoenix’s coldest month is January when the average temperature overnight is 43.4°F. In July, the warmest month, the average day time temperature rises to 104.2°F. If you would like to see specific homes as they come on the market, click here to get email updates.
? A look at Phoenix’s current Sales Price. Real Estate Market Report for November 2020
In October, Phoenix’s Median Sales Price was $316,000 up from last month’s $310,000. As inventory levels remain at unheard of low levels, we would expect there to be upward pressure on the price. With no change in the short term, expect this to continue.
If you are in the process of Buying or Selling a Home, Click on the highlighted link to see a number of interesting articles.
❓ What does this mean if you are a Buyer or a Seller?
Real Estate Market Report
As the chart above shows the Phoenix housing market Inventory is at . months up from last months .76. Buyers should be prepared for multiple offers. Make sure you make your offer as clean as possible (no contingencies). You may have to pay over list price to get the deal.
Sellers should expect multiple offers due to the low inventory. We are seeing many more multiple offers with the inventory so low. Know the market value of your home. If you start getting offers above list price and potential market price, you could be creating an appraisal issue based on what offer you take.
If you would like to see specific homes as they come on the market, click here to get email updates.
?️ What is the annual rainfall in Phoenix?

| Month | Precipitation |
|---|---|
| Jan | 0.83in. |
| Feb | 0.77in. |
| Mar | 1.07in. |
| Apr | 0.25in. |
| May | 0.16in. |
| Jun | 0.09in. |
| Jul | 0.99in. |
| Aug | 0.94in. |
| Sept | 0.75in. |
| Oct | 0.79in. |
| Nov | 0.73in. |
| Dec | 0.92in. |
The driest month in Phoenix is June with 0.09 inches of precipitation, and with 1.07 inches March is the wettest month.
?️ Homes For Sale in Phoenix AZ
Below are Homes that have come on the market in the last 7 Days around the Median price range. Also below the pictures, you will see a Chart of all the Phoenix homes by price and Type: Below are all the homes available in the city of Phoenix by Dollar amount and type:
? Below you will see the links for the other cities in the East Valley:
View All Current & Past Phoenix & East Valley Real Estate Market Reports
Contact the Shirley Coomer Group at Keller Williams Realty Sonoran Living
![]()
Call or Text: 602-770-0643 for more Real Estate Information.