Before we get into the Tempe Real Estate Market Report for April 2021, I have a commentary written by Tina Tamboer. Tina is the Senior Housing Analyst with the Cromford report. She was nice enough to let us use her summary of the Greater Phoenix Metro area as a backdrop for what is happening in Tempe this month. Here is her commentary…..
?️ The Greater Phoenix Metro Summary Analysis Real Estate Market Report
One Year After Start of Pandemic – Luxury has Exploded
Homes Selling for 101% of List Price on Average
? For Buyers:
With 54% of all sales closed over asking price so far in April, the average sale price per square foot is now higher than the list price for every price range up to $1M.
In a balanced market, homes typically sell within 97% of list price; that percentage is now 101%. This means that, for the past month or so, the majority of list prices have been the starting price for where negotiations begin instead of a top price to work down from. In past extreme seller markets, $5,000 over asking was typically enough to win a contract; that was true last year as well when the market took off. However, last January the median over ask was $6,000; by February it was 10,000; in March it was $11,000; and so far in April it’s $15,000. The highest was $905,000 over list price closed in March (It was an auction for a 10-acre property in Cave Creek that sold for $2,255,000).
By price range, over 62% of homes listed between $250K-$400K closed over asking price; the percentage is 54% for sales between $400K-$600K; 47% between $600K-$900K; 30% between $900K-$2.5M; 9.5% over $2.5M. Putting an offer in over asking price may cause a buyer some anxiety, especially a first-time home buyer. The median sale price is now $360K. Since January, the sales price per square foot for a home between $300K-$400K has appreciated 6%. That’s approximately 2% per month and the current sale price to list price ratio within the price range is 102.4%. If this rate of appreciation continues in the short term, a buyer who paid 4% over asking price on a $360K home ($14,400 over) would recoup their investment through appreciation in approximately 2 months.
? For Sellers:
The luxury market has been exploding since last summer and continues to be at the strongest level ever seen in Greater Phoenix. The number of listings under contract over $1M is up 156% over last year; but the number under contract between $2M-$3M is up 296% and over $3M is up 212%. In a typical market, sales prices in this range would be landing around 93% of list price. However in the 2021 market, the sales price ratio is averaging 98% of list.
The luxury market is also keeping up with the rest of the market in terms of marketing time. Prior to contract, half of the contracts accepted valley wide in the last week were on the market 6 days or less. Over $1M, the median was 12 days prior to contract. Over $2M, the median is 67 days. The market over $1M is outperforming in terms of annual appreciation in sales price per square foot. The median price for a 4,000-5,000 square foot home is running at $1.1M with an appreciation rate of 31%. The median price for a 5,000-10,000 square foot home is $2.3M with an appreciation rate of 35%. For perspective, the median price of a 1,500-2,000 square foot home is $365K with an appreciation rate of 25%.
Commentary written by Tina Tamboer, Senior Housing Analyst with The Cromford Report
©2020 Cromford Associates LLC and Tamboer Consulting LLC
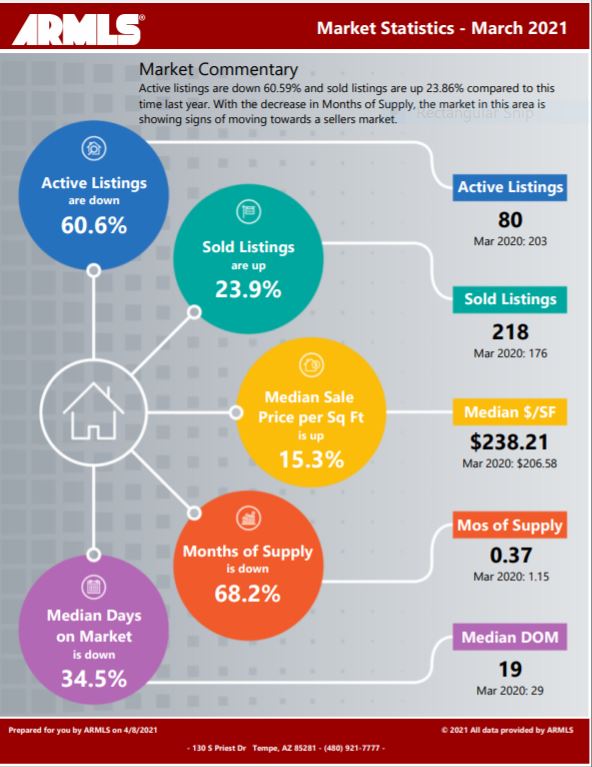
Below you will find the statistical breakdown and more for the Tempe area Real Estate Market Report March 2021.
View All Current & Past Phoenix & East Valley Real Estate Market Reports
? Below is a snapshot of Tempe’s Real Estate Market Statistics for March 2021
?️ What are the Average Temperatures in Phoenix?
| Month | Low | High |
|---|---|---|
| Jan | 43.4°F | 65.0°F |
| Feb | 47.0°F | 69.4°F |
| Mar | 51.1°F | 74.3°F |
| Apr | 57.5°F | 83.0°F |
| May | 66.3°F | 91.9°F |
| Jun | 75.2°F | 102.0°F |
| Jul | 81.4°F | 104.2°F |
| Aug | 80.4°F | 102.4°F |
| Sept | 74.5°F | 97.4°F |
| Oct | 62.9°F | 86.4°F |
| Nov | 50.0°F | 73.3°F |
| Dec | 43.5°F | 65.0°F |
Phoenix’s coldest month is January when the average temperature overnight is 43.4°F. In July, the warmest month, the average day time temperature rises to 104.2°F. If you would like to see specific homes as they come on the market, click here to get email updates.
? A look at Tempe’s current Sales Price. Real Estate Market Report for April 2021
Tempe’s Median Sales Price in March was $367,500 up from last months $355,000 and the prior months $350,000 and $344,750. In the past, Inventory levels here are one of the few areas where the number of homes on the market is higher than most other metro Phoenix areas. Prices here have remained fairly stable. Recently they have performed consistent with the rest of the valley Tempe has always been one of those unique markets since it has ASU in it. So we will see what happens next. Based on the last 4 months, it is not bucking the trend.
If you are in the process of Buying or Selling a Home, Click on the highlighted link to see a number of interesting articles.
❓ What does this mean if you are a Buyer or a Seller?
Real Estate Market Report
As the chart above shows, Inventory levels for February was .37 months of inventory down fromlast months .41 and the prior two months of .60 and .66 respectively. So, with inventory, being this low, buyers should expect multiple offers( See Tina’s comments above). Submit your offer with as few contingencies as possible. Also, make sure you know what the market price is…since you may have to go over that to get the property.
Sellers should be prepared for multiple bids on their homes. We are seeing this low inventory creating a bidding war where buyers end up bidding above the sales price to get the house. Know your actual home’s market value, since you may have to look at offers over list price. Remember, if the appraisal comes in under the purchase price, it could complicate the deal. Look for offers with appraisal waivers/ contingencies.
If you would like to see specific homes as they come on the market, click here to get email updates.
?️ What is the annual rainfall in Phoenix?

| Month | Precipitation |
|---|---|
| Jan | 0.83in. |
| Feb | 0.77in. |
| Mar | 1.07in. |
| Apr | 0.25in. |
| May | 0.16in. |
| Jun | 0.09in. |
| Jul | 0.99in. |
| Aug | 0.94in. |
| Sept | 0.75in. |
| Oct | 0.79in. |
| Nov | 0.73in. |
| Dec | 0.92in. |
The driest month in Phoenix is June with 0.09 inches of precipitation, and with 1.07 inches March is the wettest month.
?️ Homes For Sale in Tempe AZ
Below are Homes that have come on the market in the last 7 Days around the Median price range. Also below the pictures, you will see a Chart of all the Tempe homes by price and Type: Below are all the homes available in the city of Tempe by Dollar amount and type:
? Below you will see the links for the other cities in the East Valley:
View All Current & Past Phoenix & East Valley Real Estate Market Reports
Contact the Shirley Coomer Group at Keller Williams Realty Sonoran Living
![]()
Call or Text: 602-770-0643 for more Real Estate Information.