Before we get into the Tempe Real Estate Market Report for August 2020, I have a commentary written by Tina Tamboer. Tina is the Senior Housing Analyst with the Cromford report. The Cromford® Report provides detailed information to track the history and current status of the Greater Phoenix residential resale market and offers a unique insight into its future direction. Tina was nice enough to let us use her summary of the Greater Phoenix Metro area as a backdrop for what is happening in Tempe this month. Here is her commentary…..
?️ The Greater Phoenix Metro Summary Analysis Real Estate Market Report
? For Buyers
It’s a jungle out there for buyers, but, despite recent appreciation rates the HOI* measure for Greater Phoenix increased to 64.8 for the 2nd Quarter 2020; the previous measure was 63.0. So, this means that a household making the current median family income of $72,300 per year could afford 64.8% of what sold in the 2nd Quarter of 2020. By comparison, the HOI measure for the United States was 59.6.
Historically, a normal range for this measure is between 60-75. During the “bubble” years of excessive appreciation between 2005-2006, the HOI plummeted from 60.1 to 26.6. Normally, if it falls below 60, the market should start to see a drop in demand. But, the most recent increase, however, Greater Phoenix is still within normal range and experiencing demand 20% above normal for this time of year.
What makes this market significantly different from the infamous bubble and crash is the relation between resale housing growth and population growth. In the early 2000s, housing was growing faster than the population and creating a glut.
A Glut?
This glut went unnoticed due to excessive speculators (i.e. “false”) demand fueled by loose lending practices. When loans tightened up, the glut came roaring into focus as vacant inventory soared to over double the normal levels.
However, since 2006, the population has grown faster than housing. It has taken 14 years, but this population growth fueled by job growth has finally consumed the glut of resale housing created during the bubble years, and now the market is facing a shortage of homes for sale. This type of market and appreciation is not sustainable over time, however, it’s here now and properties purchased today are expected to continue appreciating over the next 6-12 months.
? For Sellers
So much for the “Summer Slowdown”. July had a record number of closings go through the Arizona Regional MLS; surpassing every July as far back as 2001. July also broke records in dollar volume with $3.9 Billion sold. The best July ever recorded prior was in 2005 at $2.9 Billion. The monthly appreciation rate finalized 12.5% higher than in 2019 and was the 4th highest appreciation rate for July going back to 2001.
One-third of homes closed was over asking price and only 15% involved any sort of seller-paid closing cost assistance; down from a high of 27% last May. Half of all sellers who accepted contracts in the first week of August did so with 7 days or less on the market. Contracts on luxury homes over $1M are up an incredible 93% over last year at this time. Between $500K-$1M, contracts are up 64%. Between $300K-$500K, they’re up 39%. Also, between $250K-$300K, up 15%. If you need to sell, this is the time to do it.
*The HOI Index stands for “Home Opportunity Index” and is published quarterly by the National Association of Home Builders and Wells Fargo. It measures the percentage of homes deemed affordable in an area based on lending guidelines, interest rates, median income levels, and median price. The most recent report was released on August 8th, 2020.
The commentary was written by Tina Tamboer, Senior Housing Analyst with The Cromford Report ©2020 Cromford Associates LLC and Tamboer Consulting LLC
Below you will find the statistical breakdown and more for the Tempe area Real Estate Market Report July 2020.
View All Current & Past Phoenix & East Valley Real Estate Market Reports
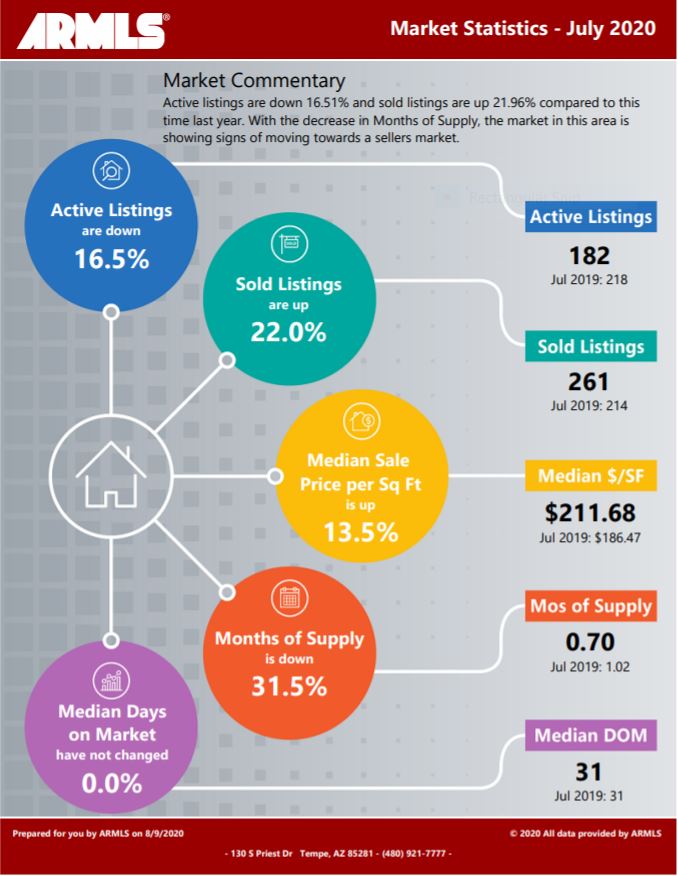
? Below is a snapshot of Tempe’s Real Estate Market Statistics for July 2020
?️ What are the Average Temperatures in Phoenix?
| Month | Low | High |
|---|---|---|
| Jan | 43.4°F | 65.0°F |
| Feb | 47.0°F | 69.4°F |
| Mar | 51.1°F | 74.3°F |
| Apr | 57.5°F | 83.0°F |
| May | 66.3°F | 91.9°F |
| Jun | 75.2°F | 102.0°F |
| Jul | 81.4°F | 104.2°F |
| Aug | 80.4°F | 102.4°F |
| Sept | 74.5°F | 97.4°F |
| Oct | 62.9°F | 86.4°F |
| Nov | 50.0°F | 73.3°F |
| Dec | 43.5°F | 65.0°F |
Phoenix’s coldest month is January when the average temperature overnight is 43.4°F. In July, the warmest month, the average day time temperature rises to 104.2°F.
If you would like to see specific homes as they come on the market, click here to get email updates.
? A look at Tempe’s current Sales Price. Real Estate Market Report for August 2020
Tempe’s Median Sales Price in July was $322,500 down from last month’s $330,000. Inventory levels on Homes under $350,000 were a greater percentage of what sold this month, slightly dropping the median price. In looking at the pending inventory going into August, it looked very similar to what sold in July. So, the August median sales price should be very close to what it was in July
If you are in the process of Buying or Selling a Home, Click on the highlighted link to see a number of interesting articles.
❓ What does this mean if you are a Buyer or a Seller?
Real Estate Market Report
As the chart above shows, Inventory levels dropped to .70 from last months .76 months of inventory. So, with inventory, this low, buyers should expect multiple offers. Try to have your offer have no contingencies. Also, make sure you know what market price is…since you may have to go over that to get the property.
Sellers should be prepared for multiple bids on their homes. We are seeing this low inventory creating a bidding war where buyers end up bidding above the sales price to get the deal. Know your actual homes market value, since you may have to look at offers over list price. Remember, if the appraisal comes in under the purchase price, it could complicate the deal.
If you would like to see specific homes as they come on the market, click here to get email updates.
?️ What is the annual rainfall in Phoenix?

| Month | Precipitation |
|---|---|
| Jan | 0.83in. |
| Feb | 0.77in. |
| Mar | 1.07in. |
| Apr | 0.25in. |
| May | 0.16in. |
| Jun | 0.09in. |
| Jul | 0.99in. |
| Aug | 0.94in. |
| Sept | 0.75in. |
| Oct | 0.79in. |
| Nov | 0.73in. |
| Dec | 0.92in. |
The driest month in Phoenix is June with 0.09 inches of precipitation, and with 1.07 inches March is the wettest month.
?️ Homes For Sale in Tempe AZ
Below are Homes that have come on the market in the last 7 Days around the Median price range. Also below the pictures, you will see a Chart of all the Tempe homes by price and Type:
Below are all the homes available in the city of Tempe by Dollar amount and type:
? Below you will see the links for the other cities in the East Valley:
View All Current & Past Phoenix & East Valley Real Estate Market Reports
Contact the Shirley Coomer Group at Keller Williams Realty Sonoran Living
![]()
Call or Text: 602-770-0643 for more Real Estate Information.