Below you will find the statistical breakdown and more for the Tempe area Real Estate Market for January 2018.
View All Current & Past Phoenix & East Valley Real Estate Market Reports
Snapshot of Tempe’s Real Estate Market Statistics for January 2018.
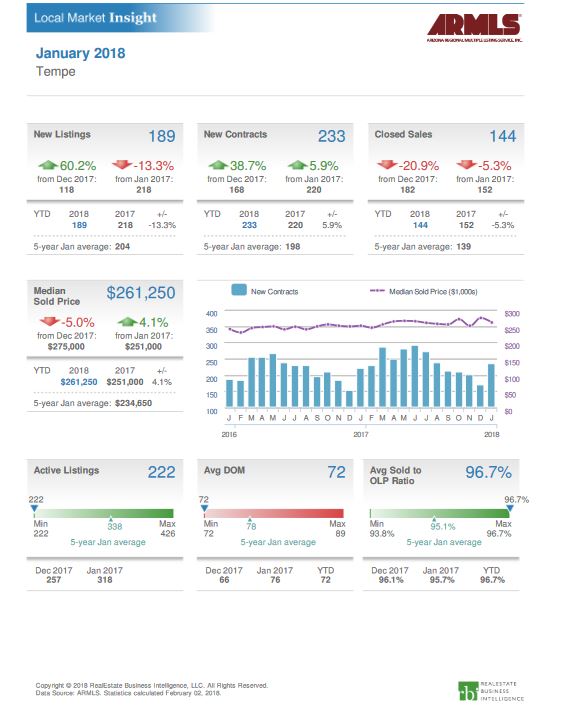
Tempe currently has 222 homes for sale, compared with 257 at the end of December. New contracts for January were 233, which is up from November’s 168 homes. This is typical for the month of January when many people start house hunting after the holidays. Closed sales decreased from 182 in December to 144 in January. This reflects homes that went under contract in December which is generally a slow month due to the holidays. The average number of days homes were on the market increased slightly from 66 days in December to 72 days in January. The sales to list price for Tempe increased slightly from 96.1% in December to 96.7% in January.
Tempe Homes for Sale by Bedrooms & Median price:
What does this mean if you are a seller?
As a seller, we saw more new listings come on the market in January. This is typical as many sellers who did not want their homes on the market over the holidays listed in January. Also, fewer homes went under contract in January as compared to December since folks started looking for homes after the new year. This shows in the new contract volume which increased by 38.7% over December. The Tempe market continues to be a seller’s market with less than 2 months of inventory available. The real estate industry considers less than 3 months of inventory to be a seller’s market where in January Tempe was at 1.54 months of inventory. With a strong increase in Median sales price last month, the Tempe median price settled in January by dropping 5% down to $261,250. While this is a seller’s market, buyers are still carefully evaluating the homes they are willing to purchase and are not willing to overpay. We still see homes that expire or cancel even in a seller’s market. This reflects the seller’s not willing to price their home realistically for the market.
![]()
What does this mean if you are a buyer?
If you were a buyer in January, you had many more homes to choose from as many sellers put their homes back on the market after the holidays. It was an active month with the volume of homes available dropping from December’s 257 down to 222 a 13.6% decrease. Good news the median sales prices dropped by $13,750. The average list to sales price increased by .6%. Sellers are still averaging 96.7% of asking price. Buyers need to be diligent and expect many homes to have multiple offers due to the low available inventory. Buyers need to have their agent look at comps for homes closely as they are considering an offer. This is a very competitive market.
Homes For Sale in Tempe
Below are Homes that have come on the Market in the last 7 Days around the Median price range in Tempe. Also below the pictures, you will see a Table by $$ amount and type for all of the Tempe listings:
Below are all the Homes available in the city of Tempe by Dollar amount and type:
Below you will see the links for the other cities in the East Valley:
View All Current & Past Phoenix & East Valley Real Estate Market Reports
