Below you will find the statistical breakdown and more for the Tempe area Real Estate Market for February 2019.
View All Current & Past Phoenix & East Valley Real Estate Market Reports
Below is a snapshot of February’s Real Estate Market Statistics for Tempe AZ:
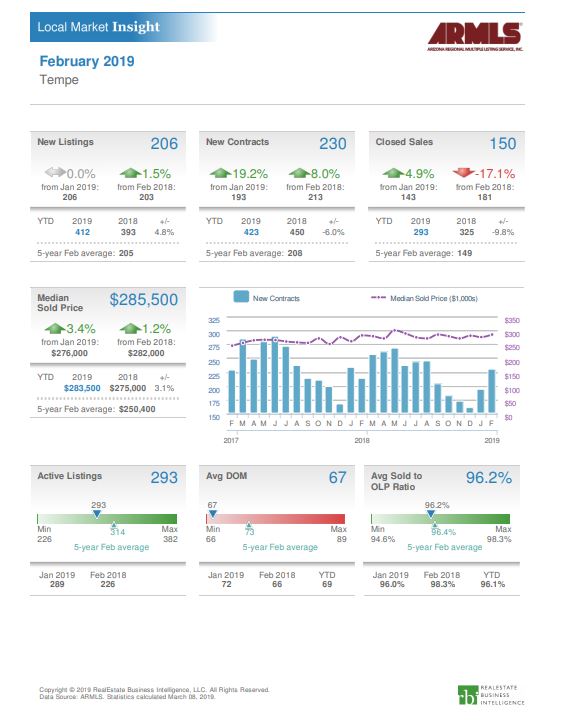
The number of new listings in Tempe for February was 206 was flat to January. New contracts increased by 19.2% to 230. We saw 150 home sales completed in January up 4.9% from January. Median sales price was $285,500 up 3.4% from January. There were 293 active listing in Tempe with the average days on market of 67. The average sold price to list price was 96.2% up by .2% from prior month.
Tempe Homes for Sale by Bedrooms & Median price:
What does this mean if you are a seller?
For sellers, inventory levels remained flat (1.95 in Febuary vs 2.02 in January) while sales volume decreased by 4.9% from the prior month. This shows us hovering at a weak balanced market. The forecast however was a moving toward a stronger balanced market which did not occur. If priced correctly, sellers can expect to get Market rate for their property. Buyers are not going to overpay, but houses priced correctly and in good condition will sell. For February, we saw the list to contract price of 96.2% up by .2% from January. We also saw the median price increase by 3.4% to $285,500.
What does this mean if you are a buyer?
Based on the last couple of months and the expert forecasts, Buyers were expecting an increase in the homes available…that did not happen. Months of inventory dropped from 2.02 in January to 1.95 in January. Anything under 3 months of inventory is considered a seller’s market. So those homes that are priced right may get multiple offers. The buyer has to remain diligent about their offers. If you are serious about an offer, have your agent provide you comparable properties to determine the best price for the house. Buyers need to watch the market closely to see what trend arises. The expectation is that the market will move to a balanced position.
Homes For Sale in Tempe AZ:
Below are Homes that have come on the Market in the last 7 Days around the Median price range. Also below the pictures, you will see a Chart of all the Tempe homes by price and Type:
Below are all the Homes available in the city of Tempe by Dollar amount and type:
Below you will see the links for the other cities in the East Valley:
View All Current & Past Phoenix & East Valley Real Estate Market Reports